
Commercial Decision Intelligence
Better commercial decisions with AI you can trust.
Molsaro models what a pricing, promotion, portfolio or account decision is worth — then hands back the finished analysis, sourced and ready for the room.
Consumer Goods
Pharma & Life Sciences
Retail
Manufacturing
Built for the decisions your quarter turns on.
Price architecture
Across tiers, packs and channels
Promotion plan
What to run, and what to cut
Joint business plan
The annual retailer negotiation
Launch & innovation
Go, no-go, and what it cannibalises
Portfolio & delist
What earns its place on shelf
Annual plan
The number, and the path to it
From the first question to the committed plan.
Four reasons commercial teams move their pricing, promotion, portfolio and account decisions onto Molsaro.

Grow your business faster
Find the growth that is already available in your price, mix, promotion and assortment — and know what each point of it is worth before you go after it.

Simulate anything.
Test everything.
Price, pack, promotion, launch, delist, trade terms — every option modelled against your own demand response, with the range around it.

Autonomous optimization and improvement
Specialists that keep watching after the decision is made — finding the leaks, testing the next move, and getting sharper with every cycle.

From insights and planning to action
The evidence, the plan and the finished deliverable in one place — so the answer arrives as work your team can take into the room.
The output
Finished work, not another dashboard.
Molsaro hands back the same artefacts your team already builds by hand — with the evidence attached and the range around every number.
Decision brief
4 pages · 11 sources
Premium tier price review
Recommended +6% on the premium tier from period 4
Margin
+5.8 pts
Volume
−2.1%
Margin range +3.9 to +7.4 pts across the modelled cases
–
Two mid-tier SKUs absorb 40% of the lost volume
–
Assumes no competitor response inside 8 weeks
Account review pack
Ready
Q3 joint business plan — national grocer
Performance versus last year, by category
Promotion returns, ranked
Price position against the two nearest rivals
Give-get options, priced both ways
Every figure linked to its source
Rebuilt automatically each time the account’s data closes.
Weekly executive brief
Monday, 07:00
What moved, and what it means
−1.4 pts
Share slipped in the premium tier — two rivals cut shelf price in week 32
+£0.9m
The pack-price change is running ahead of plan in convenience
Watch
Trade spend on two accounts is tracking 18% above the agreed envelope
Each line opens into the analysis behind it.

Simulation
Every option has a cost. See it before you choose.
Price, promotion, launch, delist — Molsaro models each option against your own demand response and shows the trade-off between volume and margin, with the uncertainty around it.
The whole portfolio, not one SKU.
See what grows, and the two lines quietly funding it.
Competitive response modelled,
so the answer holds when a rival moves too.
A range, not a point estimate.
The downside is visible before you commit.
The trade-off, plotted
Three options against the same baseline. Bars show the modelled range.


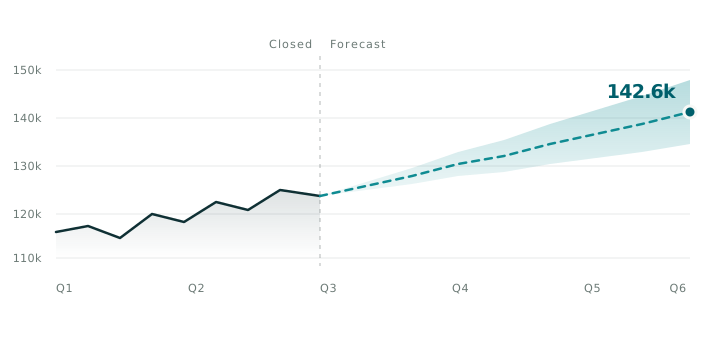
Volume forecast · Brand A · next four quarters
The shaded band is where the model expects the actual to land. Expected range · 134.1k – 151.0k
How close it has been landing
within 4.8%
One month out
within 7.6%
One quarter out
within 11.2%
Two quarters out
Tracked per series, so you know which lines have earned the benefit of the doubt.
Forecasting
A number you can take to the board.
Price, promotion, distribution, competitor moves and seasonality all feed one model — so the forecast under your plan, your scenarios and your account commitments is the same number, and you can show exactly how it was built.
Commit with confidence.
Every forecast shows how tightly it has been landing, so you know which numbers to stand behind and which to challenge.
Explainable, line by line.
When the number moves, you can see which driver moved it — before someone asks you in the meeting.
It keeps up with the market.
The forecast updates as periods close, so the plan reflects the business as it is now, not as it was at budget.

Molsaro AI
Ask the question you would ask your best analyst.
Molsaro finds the data, runs the models, reads your documents and the market, and answers with the working shown — every figure traceable to where it came from.
It finds the data and runs the models.
No hand-off, no analyst queue, no waiting for the next cycle.
It reads your documents and the market.
Internal research and live signals land in the same answer.
It tells you what to do next.
Not just which driver moved — which lever to pull, and what it is worth.
You
M
Revenue is up 6.8% year to date, and the growth is yours rather than the category’s — four of the six drivers are levers you control.
Revenue bridge · YTD 2026 vs YTD 2025
+6.8%
142.0
+2.9
+3.6
Price
+1.8
Mix
+4.2
−1.6
−1.2
151.7
Your growth is share, not market.
Distribution and price added £7.8m against £1.8m of category growth. Two rivals lost listings in the same accounts — this holds even if the category flattens.
Promotion is buying volume below the margin line.
−£1.6m against +£2.9m of volume. Both deep-cut weeks in the grocers returned under 0.7×. Dropping them costs ~£0.4m of volume and returns ~£1.1m of margin.
The distribution win is repeatable.
68% of the gain came from two accounts running the same pack-price mechanic. Three more accounts have the same gap — worth roughly £2.4m if it lands at the same rate.
Which three accounts?
Model dropping the deep-cut weeks
Build the plan
Sources · revenue and mix by retailer, YTD · distribution by account and SKU · promotion post-mortem, 14 mechanics
Ask a follow-up…
Agents & automation
The work that comes back every month, already done.
Brief a specialist once — the objective, the sources it may use, who signs off. It runs on your schedule and hands back something finished.
Competitor Price Monitor
Price and promotion changes across your tracked rivals
Daily
Promotion Post-Mortem
What each mechanic returned, and what to drop next cycle
Per cycle
Account Review Pack
The negotiation pack, rebuilt as the account’s data closes
Per meeting
Margin Leak Detector
Deals and terms drifting outside the agreed envelope
Weekly
Launch Watch
Rival launches and range changes while they are still signals
Daily
Weekly Executive Brief
What moved, why it moved, and what needs a decision
Mon 07:00
Account review pack
Q3 joint business plan · national grocer
Where the account stands
+4.2%
Value vs. last year
−0.8 pts
Share of category
−1.6 pts
Gross margin rate
Give-get, priced both ways
They ask
+2 pts trade funding
−1.1 pts
You ask
Second facing on the top four SKUs
+1.9 pts
You ask
Two fewer deep-cut weeks
+0.6 pts
Net
If all three land
+1.4 pts
Walk-away
Funding above +2.6 pts turns the plan margin-negative even if every ask lands.
Every figure links to the period, the source and the model run behind it.
Browse all 55 specialists
Knowledge & insight
The answer is usually already in the building.
Big decisions get made without the research you already paid for — because nobody could find it in time. Molsaro reads every study, strategy paper and past decision alongside live market intelligence, and brings the relevant ones into the answer.
Research brief
How will the premium segment develop over the next 18 months?
1
Premium is taking share from mainstream in three of your four channels, and the trade-up is holding through the current cost cycle.
Category review, Q4
Panel data · 24 months
2
Your own 2024 shopper study reached the opposite conclusion — it was run before the two competitor launches that changed the segment.
Shopper study, 2024
Two launch announcements
3
The pack sizes winning share are the ones you deprioritised in last year’s range review.
Range review minutes
EPOS by pack size
Every claim carries its source, its date and how confident the evidence is.
What it reads
Internal research
Studies, category reviews, shopper work
Strategy & decisions
Plans, papers, and what you decided last time
Market data
Panel, EPOS and syndicated measurement
Live market signals
Competitor moves, pricing, launches, news
Explore enterprise intelligence
Sources cited.
Every figure points back to where it came from.
Methods named.
You can see how a number was produced, not just what it is.
Ranges kept.
Uncertainty is shown, never rounded away.
Permissions enforced.
Agents and answers respect the access the person already has.
Row-level tenant isolation
Encrypted in transit and at rest
Regional data residency
Full audit trail
SSO & SCIM
Industries
Built for markets where every choice interacts.



Get started
Bring a decision you are about to make.
A pricing move, a launch, an account negotiation, a forecast you do not trust. We will show you what Molsaro does with it — on your data, in the demo.